Advanced Excel is a collection of Microsoft Excel tools and features that assist users with data analysis, visualization, and reporting. It can assist users with intricate automation, simulation, and computation tasks. To assist in making strategic decisions, business analysts evaluate complicated data using sophisticated Excel. Upskill your fundamentals with our advanced Excel tutorial for beginners. Explore our advanced Excel course syllabus here.
What can advanced Excel do?
Learning advanced Excel helps gaining expertise with the following:
- Data visualisation: Make timelines, charts, and graphs.
- Data analysis: To examine data, use functions like VLOOKUP, HLOOKUP, SUMIF, and COUNTIF.
- Data validation: Establish guidelines to restrict what can be typed into cells and stop incorrect data entering.
- Automation: To automate operations, use VB programming and macros.
Some advanced Excel functions:
CONCATENATE, VALUE, IFERROR, TEXTJOIN, DSUM, DCOUNT, Pivot Table, and Pivot Chart.
Learn Excel from Beginner to Advanced
Here are the advanced Excel concepts to get started with Excel course beginner to advanced.
Advanced Formulas and Functions
Beyond simple functions like SUM and AVERAGE, MS Excel offers more sophisticated formulas and functions, such as VLOOKUP, INDEX MATCH, SUMIF, COUNTIF, OFFSET, IFERROR, CONCATENATE, and XLOOKUP, that enable intricate data manipulation, conditional computations, and data lookups across multiple tables within a spreadsheet.
Some Common Advanced Functions in MS Excel:
- VLOOKUP: A value in a table can be found using the VLOOKUP function, which also returns a value from a different column in the same row.
=VLOOKUP(lookup_value, table_array, col_index_num, [range_lookup])
- INDEX MATCH: For more flexible lookups, INDEX MATCH combines the INDEX function (which retrieves a value from a table) with MATCH (which determines a value’s position).
=INDEX(return_range, MATCH(lookup_value, lookup_range, 0))
- SUMIF/COUNTIF: Adds up or counts cells according to a predetermined standard or condition.
=SUMIF(range, criteria, [sum_range])
=COUNTIF(range, criteria)
- OFFSET: Defines a beginning cell, rows, and columns to shift from in order to create a dynamic range.
- IFERROR: Enables better data presentation by returning a specified value in the event that a formula produces an error.
=IF(AND(A1>10, B1<5), “Yes”, “No”)
- CONCATENATE: Constructs a single string by joining text from several cells.
- XLOOKUP: Provides a more flexible lookup function than VLOOKUP, enabling both vertical and horizontal lookups.
Array Formulas: Apply several computations on one or more array items. One or more items in an array can be subjected to numerous calculations using array formulae. In order to enter an array formula, use Ctrl + Shift + Enter.
Example: Sum the product of two ranges.
{=SUM(A1:A10*B1:B10)}
AGGREGATE: AGGREGATE(function_num, options, array, [k]) ignores hidden rows, error values, and other specified conditions while carrying out a variety of aggregate functions (SUM, AVERAGE, etc.). It provides greater control over typical aggregate functions.
Example: =AGGREGATE(1, 6, A1:A10) will return the average of A1:A10, ignoring error values.
Logical Functions: IF, AND, OR, NOT, IFERROR.
Lookup Functions:
- VLOOKUP / HLOOKUP: Vertical and horizontal lookups.
- INDEX + MATCH: More flexible than VLOOKUP.
- XLOOKUP (Excel 365+): Replaces VLOOKUP and HLOOKUP with more functionality.
Text Functions: LEFT, RIGHT, MID, CONCATENATE, TEXT, TEXTJOIN.
Date and Time Functions: TODAY, NOW, DATEDIF, NETWORKDAYS, EOMONTH.
Math and Statistical Functions: SUMPRODUCT, COUNTIF, SUMIF, AVERAGEIF, RANK, PERCENTILE.
Dynamic Arrays: Formulas can spill results into many cells when using dynamic arrays.
Example: To extract unique values from a list, use UNIQUE.
=UNIQUE(A1:A10)
These functions automatically spill results into neighboring cells, such as FILTER, SORT, UNIQUE, and SEQUENCE.
- A range is filtered using the parameters FILTER(array, include, [if_empty]).
- A range is sorted using SORT(array, [sort_index], [sort_order], [by_col]).
- The function UNIQUE(array, [by_col], [exactly_once]) yields values that are unique.
- A sequence of numbers is produced by using SEQUENCE(rows, [columns], [start], [step]).
Recommended: Advanced Excel Online Course Program.
Data Analysis Tools in Advanced Excel
PivotTables, Power Query, Analysis ToolPak, Power Pivot, conditional formatting, sophisticated formulas and functions, sorting and filtering, and data visualization tools like charts are some of the essential data analysis tools in advanced Excel that let users efficiently work with, examine, and display big datasets.
- PivotTables: An effective tool for condensing and analyzing big datasets, these interactive tables make it simple to filter and group data in order to spot trends and patterns.
- After choosing your data, select Insert > PivotTable.
- Fields can be dragged and dropped into values, filters, rows, and columns.
- For interactive filtering, use Slicers (found under PivotTable Analyze).
- Power Query: Makes data preparation more effective by enabling data loading, transformation, and cleaning from several sources right within Excel.
- Go to Data > Get & Transform Data > Get Data.
- Connect to data sources (e.g., Excel tables, databases, or web).
- Use the Power Query Editor to clean, reshape, and combine data.
- Analysis ToolPak: An integrated Excel add-in that offers sophisticated statistical analysis features like z-tests, regression, histograms, and sampling.
- Power Pivot: It is a data modeling tool that enables sophisticated computations on big datasets and the creation of intricate linkages between tables.
- Conditional Formatting: It helps visually identify patterns and outliers by highlighting particular data points according to predetermined criteria.
- Advanced Functions and Formulas: To carry out elaborate computations and data manipulation, use sophisticated Excel tools like array formulae, INDEX MATCH, and VLOOKUP.
- Sorting and Filtering: Sorting and filtering are fundamental yet necessary functions to arrange data according to particular standards and retrieve pertinent information.
- Data Validation: Limit data entry to predetermined standards (e.g., date ranges, drop-down lists).
- What-If Analysis:
- Goal Seek: Identify the input required to accomplish a particular outcome.
- Data Tables: Examine the effects of altering factors on results.
- Scenario Manager: Evaluate various situations.
Related Training: Data Analytics Training in Chennai.
Advanced Data Validation
Advanced data validation in Microsoft Excel is the use of sophisticated formulas in the data validation feature to enforce complex rules on data entry, going beyond simple checks like permitting only numbers or dates.
These rules can include things like preventing duplicate entries, guaranteeing data consistency across multiple cells, or validating data in a spreadsheet based on predetermined conditions.
Custom Formulas: The most potent feature of sophisticated data validation is the use of custom formulae in the “Data Validation” dialog box, which let you specify particular requirements for valid data using logical operators, functions like COUNTIF, and VLOOKUP.
Examples of complex validation rules:
- Preventing duplication: To avoid duplicate entries, a formula such as =COUNTIF($A$2:$A$100,A2)<2 determines whether the value in the current cell already occurs in a range.
- Dependent dropdowns: These create cascade data validation by using formulas to build dropdown lists dependent on selections made in other columns.
- Range checks with conditions: Making sure a “Quantity” is smaller than the available “Inventory” or that a number falls within a certain range based on values in other cells.
- Data type consistency: Using text functions to verify that entered data adheres to a predetermined format (such as an email address or phone number).
Ways to Access Advanced Data Validation:
- Select the cells to validate: The range of cells to which you wish to apply data validation should be highlighted.
- Open Data Validation: Click “Data Validation” after selecting the “Data” tab.
- Choose “Custom” formula: Choose “Custom” under “Allow,” on the “Settings” page.
- Enter your formula: Enter your own formula that specifies the validation criteria in the “Formula” field.
Conditional Formatting
Use rules (such as color scales, data bars, and icon sets) to highlight cells. By applying formats (such as colors) according to conditions, conditional formatting aids in data visualization.
- Select your data, then go to Home > Conditional Formatting.
- Use options like Highlight Cell Rules, Data Bars, or Color Scales.
Example: Highlight every cell whose values are higher than average.
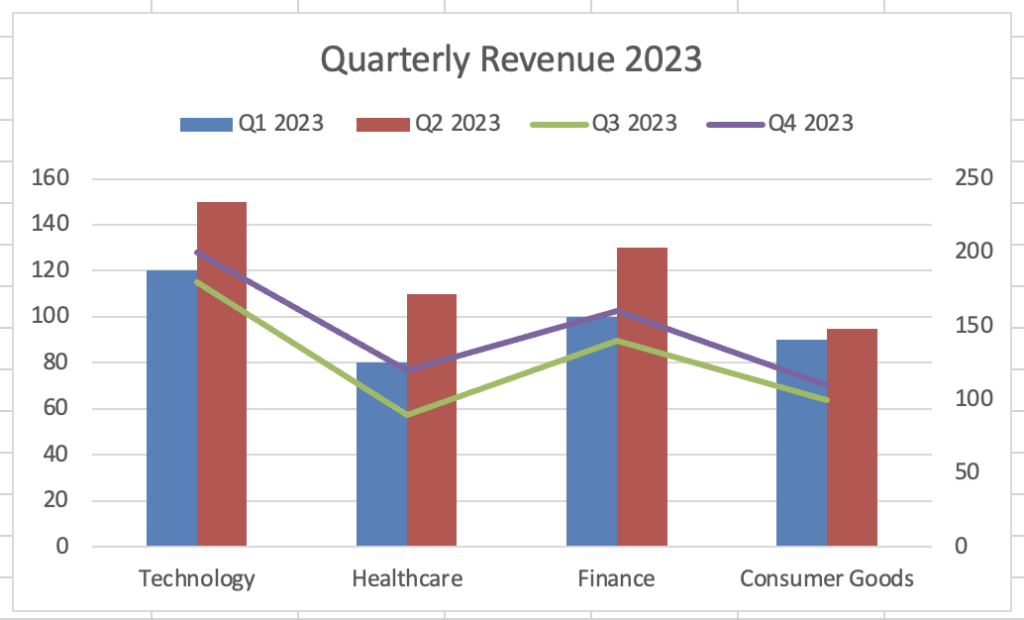
Advanced Charts in MS Excel:
Combo charts (e.g., line and bar charts combined):
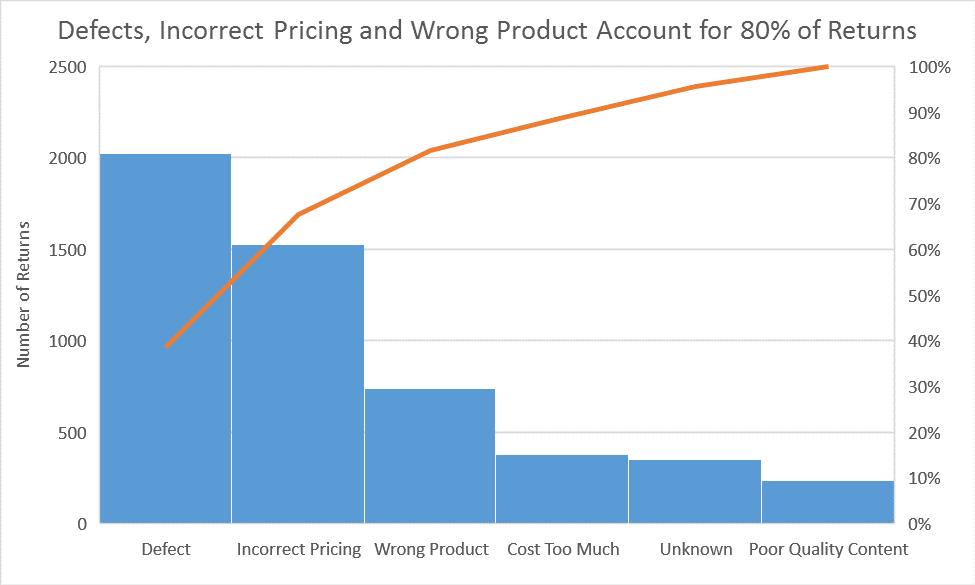
Waterfall charts, histograms, and Pareto charts:
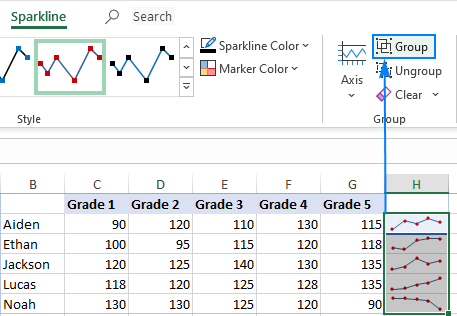
Sparklines: Mini charts within a cell.
Dynamic Dashboards: For interactive reporting, combine slicers, charts, and pivot tables.
Utilize our data science courses in Chennai for further learning.
Macros and VBA (Visual Basic for Applications)
VBA (Visual Basic for Applications) is the programming language used to create and modify macros, which are recorded sequences of actions that can be automatically replayed to perform repetitive tasks within an application.
These macros are primarily used within Microsoft Office applications such as Word and Excel, and they enable users to automate complex tasks with custom code.
Macros: A macro saves time on repetitive activities by recording your actions within an application, such as clicking particular buttons, entering data, or formatting cells, and then replaying those processes when prompted.
VBA: The underlying programming language for creating and editing macros is provided by VBA, which lets users write more sophisticated logic than just recording. This includes loops, conditional statements, and data access from various application components.
- Go to View > Macros > Record Macro.
- Perform your actions, then stop recording.
- Edit the macro in the VBA editor (Alt + F11) for more advanced automation.
In the majority of Microsoft Office apps, you may build and manage your macros by pressing “Alt + F11” on your keyboard to launch the VBA editor.
Example VBA Code:
Sub AutomateFormatting()
Dim rng As Range
Set rng = Range(“A1:C10”)
rng.Font.Bold = True
rng.Interior.Color = RGB(200, 220, 255)
End Sub
Advantages of utilizing macros and VBA:
- Automation: Automate repetitive tasks to increase productivity and save time.
- Customization: Develop solutions specifically suited to an application’s requirements.
- Data Manipulation: Use the program to access and work with big datasets.
Example of a simple macro in Excel using VBA:
Task: Use VBA code to automatically format all cells inside a given range to bold.
VBA Code:
Sub FormatCellsBold()
Range(“A1:C10”).Font.Bold = True
End Sub
Explore our VBA Macros training in Chennai.
Advanced Data Manipulation in MS Excel
Using powerful tools like PivotTables, intricate formulas (like INDEX MATCH), conditional formatting, data validation, Power Pivot, and VBA macros to efficiently analyze, summarize, and transform large datasets is known as advanced data manipulation in Microsoft Excel. This enables deeper insights and well-informed decision-making beyond simple computations.
- Text to Columns: Use delimiters to divide data into several columns.
- Remove Duplicates: Clear datasets by eliminating entries that are duplicates.
- Advanced Filtering: To filter data, apply intricate criteria.
- Array Manipulation: To carry out bulk operations, utilize array formulae.
Applications of advanced data manipulation in Excel:
- Sales Analysis: Finding top-performing sales representatives and examining regional or product-category sales patterns are examples of sales analysis.
- Financial Forecasting: Developing intricate financial models with several variables and scenarios is known as financial forecasting.
- Market Research: Analyzing consumer demographics and behavior trends is known as market research.
- Performance Tracking: It is the process of tracking important data over time and pinpointing areas that require improvement.
Review your VBA Macros skills with our VBA Macros interview questions and answers.
Collaboration and Security in MS Excel
Sharing workbooks with others in Microsoft Excel facilitates collaboration by enabling multiple users to edit the same file at once. Security is controlled by features like password protection, cell editing restrictions, and permission setting, which limit who can access and alter particular data sections and guarantee data integrity in a collaborative setting.
Collaboration in Advanced Excel:
- Sharing Workbooks: By selecting “Share” and inputting collaborators’ email addresses, you may quickly share an Excel file with others, enabling real-time access and editing.
- Co-authoring: Several people can work on the same spreadsheet at once and view each other’s changes as they are made thanks to cloud-based storage services like OneDrive.
- Comments and Annotations: Within the workbook, users can ask questions or offer feedback by leaving comments on particular cells.
- @mentions: By using the “@” symbol in a comment and then the collaborator’s name, you can immediately alert them.
Security in Advanced Excel:
- Password protection: To stop unwanted access to private information, you can set a password to open a workbook.
- Sheet protection: A workbook’s individual sheets or ranges can be secured so that only authorized users can make changes to particular cells while others can only view the data.
- Data validation: To ensure data accuracy, you can limit the kinds of data that can be entered in particular cells by establishing data validation rules.
- Permissions control: You can provide people varying degrees of access to a workbook when sharing it, enabling some to alter the data while others can only see it.
- Row-level security: Depending on their access level, various users can view just particular rows of data due to advanced capabilities that enable security based on user roles.
Ways to collaborate and secure an Excel file:
- Save to cloud storage: To facilitate simple sharing and real-time collaboration, make sure your Excel file is kept on a cloud platform such as OneDrive.
- Select “Share”: To view sharing options, click the “Share” button in the Excel ribbon.
- Configure Permissions: Decide who you wish to share with and set their degree of access (edit, view only, etc.).
- Protect Private Information: To password-protect individual cells or the entire workbook, use the “Protect Sheet” or “Protect Workbook” function.
Get upskilled with our Azure training in Chennai.
MS Excel Integration with Other Tools
By integrating Microsoft Excel with different applications, such as CRMs, databases, project management software, and data analytics platforms, users can easily extract data from multiple sources into their spreadsheets, carry out intricate analyses, and view the outcomes. This improves workflow efficiency and data manipulation capabilities.
Important techniques for integrating Excel:
Data Import/Export:
- Copy and Paste: transferring data from one program to Excel by hand.
- CSV Files: They are used to export data as comma-separated values from other programs and import them into Excel.
- APIs: Directly importing data into Excel from other systems through application programming interfaces.
Add-ons and connectors:
- Microsoft Power Query: A built-in Excel tool for retrieving and modifying data from a variety of sources, including databases, web services, and other applications.
- Third-Party Add-Ins: Expert add-ins that connect to particular programs, such as Google Analytics, Salesforce, or QuickBooks, to increase the capabilities of Excel.
Examples of Excel integration with other tools:
- CRM Integration: It is the process of importing client information into Excel for reporting and analysis from a CRM system, such as Salesforce.
- Database Integration: It is the process of immediately querying and importing data into Excel by connecting to a database (such as SQL Server).
- Project Management Integration: It is the process of importing project data into Excel for tracking and reporting from a project management application, such as Microsoft Project.
- Data Visualization Tools: To produce interactive charts and dashboards, export Excel data to a data visualization platform (such as Power BI).
Advantages of integrating Excel with other applications:
- Streamlined Workflow: By automatically retrieving data from other apps, this process does away with manual data entering.
- Improved Analysis: The capacity to integrate information from several sources for thorough analysis.
- Better Reporting: Consolidate data from many platforms into a single Excel sheet to generate personalized reports.
- Collaboration: To work together on data analysis and reporting, team members can share Excel files.
Suggested: Power BI Course in Chennai.
Keyboard Shortcuts for Efficiency
You can save a great deal of time by becoming proficient with keyboard shortcuts. Here are a few more sophisticated ones:
- Ctrl + Shift + L: Apply/remove filters.
- Alt + =: Auto-sum selected cells.
- Ctrl + T: Convert a range into a table.
- Ctrl + Shift + Arrow Keys: Select entire rows or columns.
- Alt + Enter: Insert a line break within a cell.
- Ctrl + Space: Select the entire column.
- Shift + Space: Select the entire row.
Explore all our in-demand software courses here.
Conclusion
Practicing with real-world examples is the most effective method for learning advanced Excel. You can begin your advanced Excel journey with this tutorial. Concentrate on the topics that are most pertinent to your requirements and progressively increase your understanding. We hope this advanced Excel tutorial for beginners will help you understand the concepts. Gain expertise with real-time projects through our advanced Excel training in Chennai.